A collection of my cartographic works & data visualizations
Description
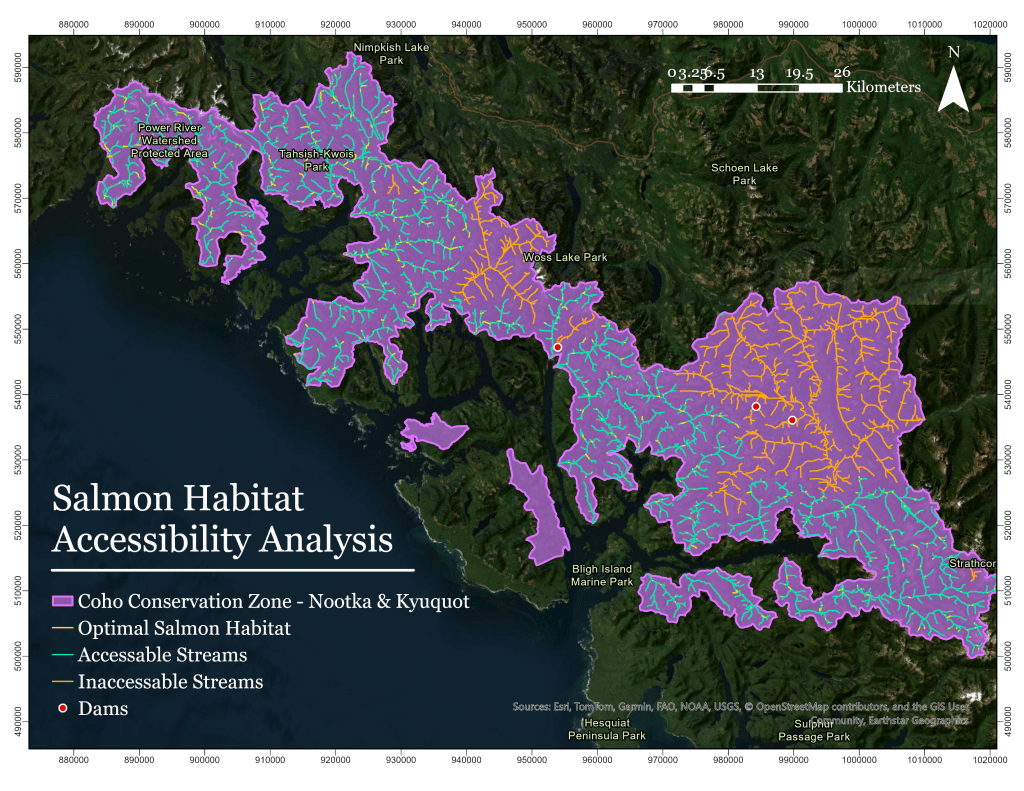
This salmon stream habitat and accessibility analysis was derived from a digital elevation model of the Vancouver Island. Using hydrological extraction, network topology, and linear referencing tools in ArcGIS Pro, this process modelled stream order, slope gradient, and spawning habitat suitability to evaluate accessible upstream habitat for Pacific Salmon.
Description
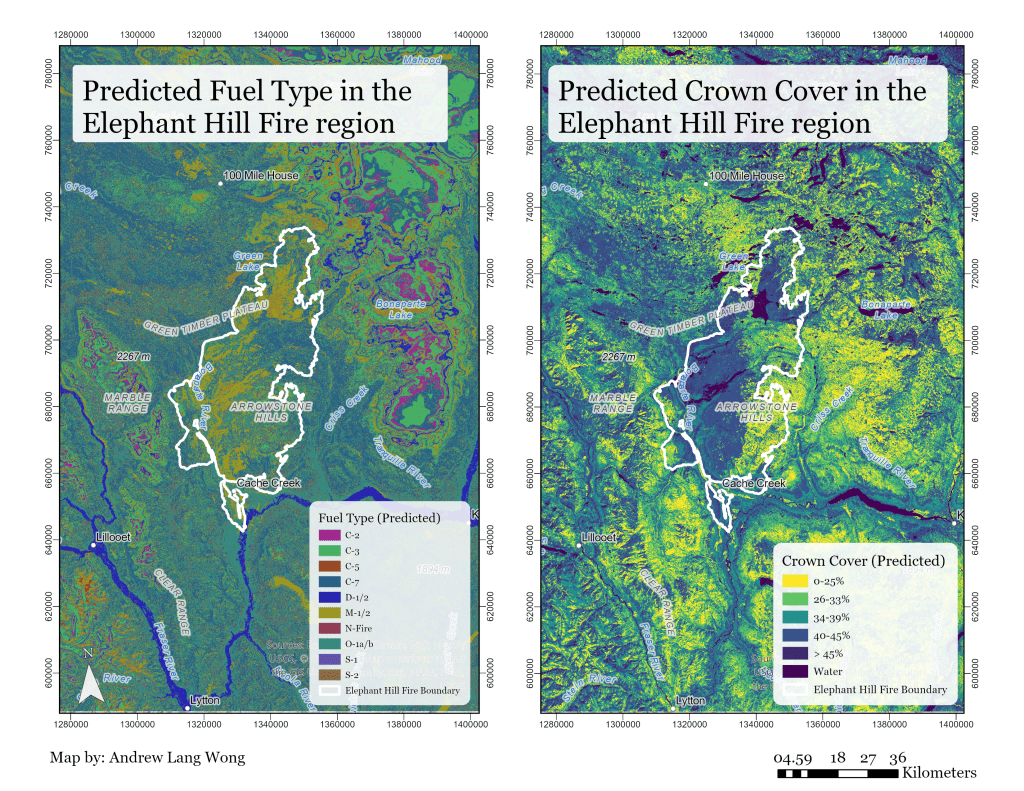
This fuel type and crown cover analysis of the Elephant Hill wildfire burn area was created from multiple remote sensing and climate data sources. Using a Random Forest machine learning classifier trained on Landsat indices, VRI data, ClimateNA variables, and ASTER imagery, wall-to-wall estimates of crown closure and fuel type class were predicted.
Description
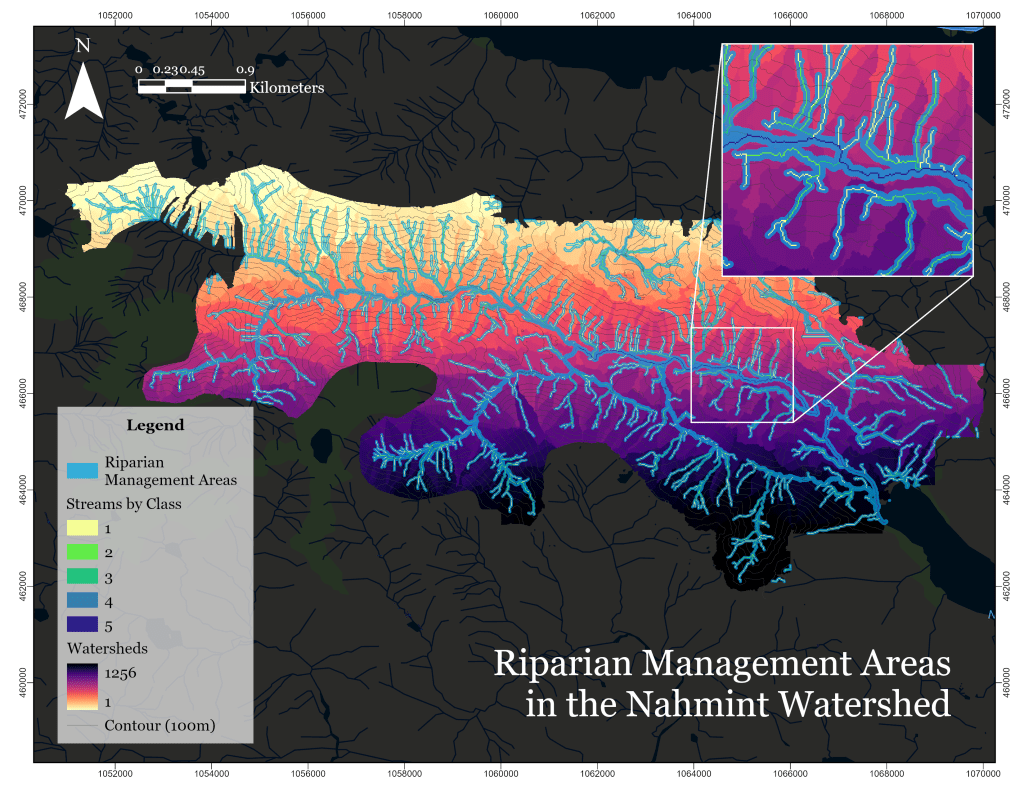
This analysis delineated Riparian Management Areas within the Nahmint Watershed by applying British Columbia’s Riparian Area Management Guidelines to a digital elevation model, integrating terrain-based hydrological modeling and stream network analysis to establish buffer zones for future land and resource management.
Description
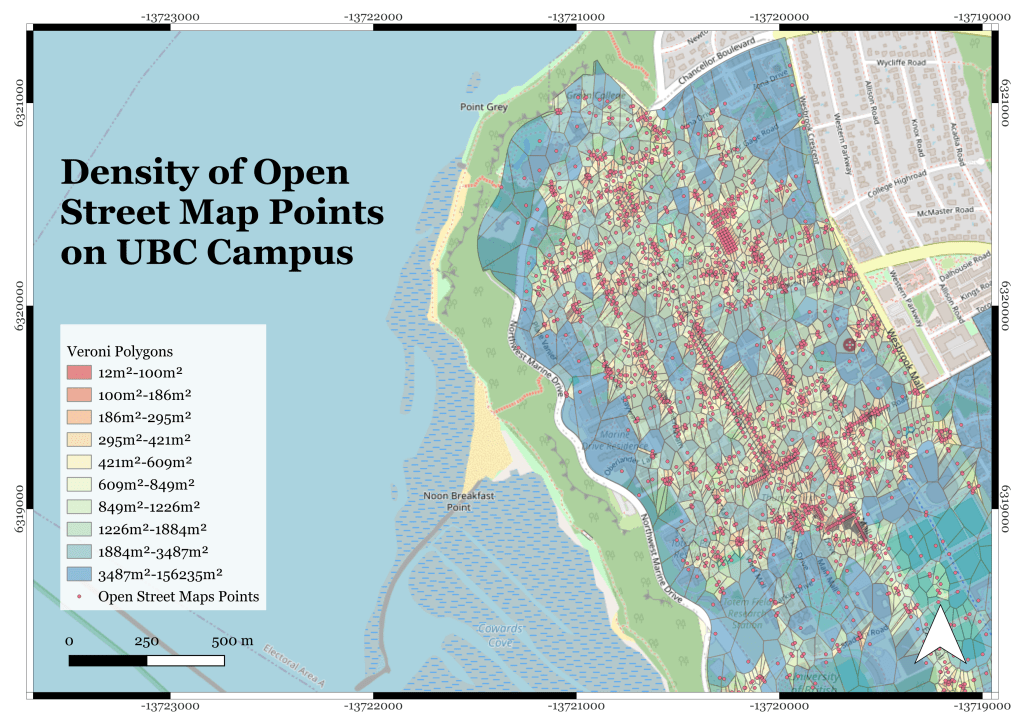
This Voronoi density analysis was conducted on OpenStreetMap point data on UBC campus. Using the Voronoi polygon tool and spatial aggregation techniques in QGIS, the process partitioned geographic space based on the density of user-input map points. This project illustrates the strength of open-source data and open-sourced software for urban land use planning.
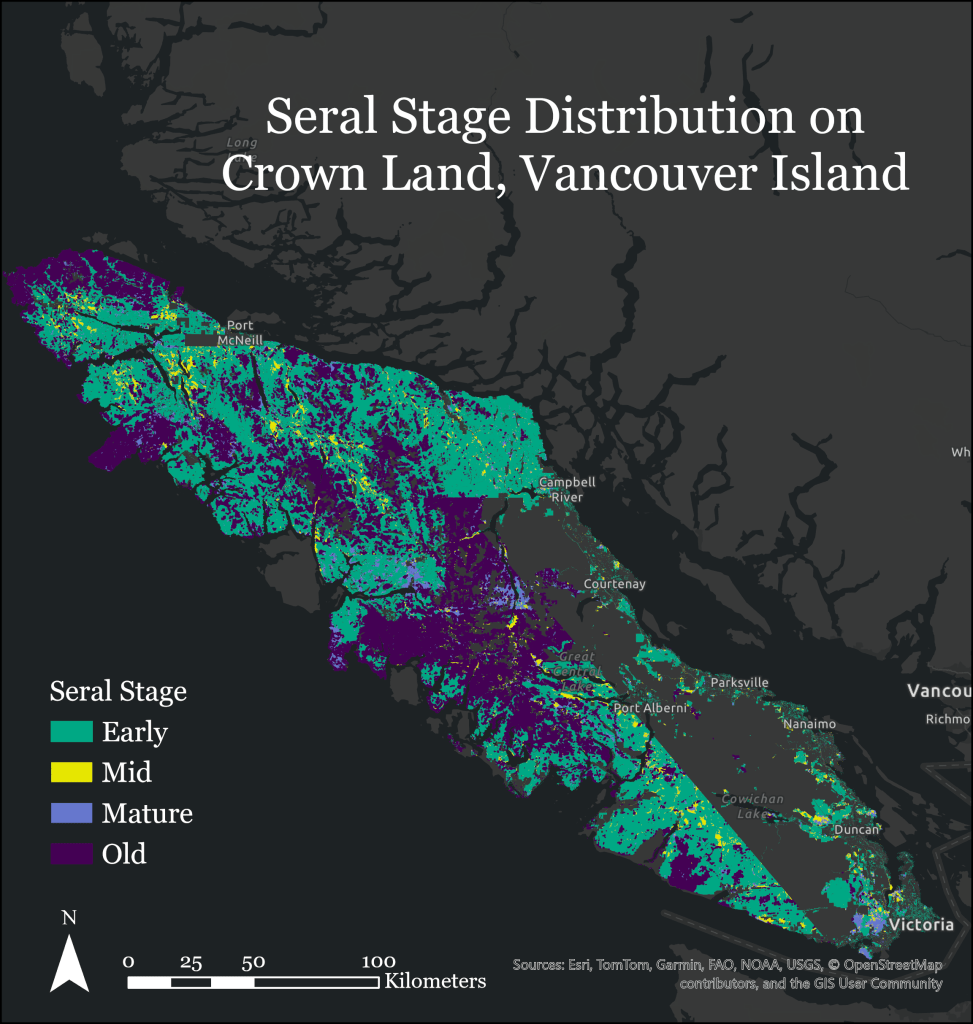
Description
This seral stage distribution analysis was created using the Vegetation Resources Inventory for Crown land across Vancouver Island. Using attribute standardization, forest management landbase filtering, and area calculation techniques in ArcGIS Pro, forest successional stages and old-growth extent were quantified to better understand the current state of forest management.
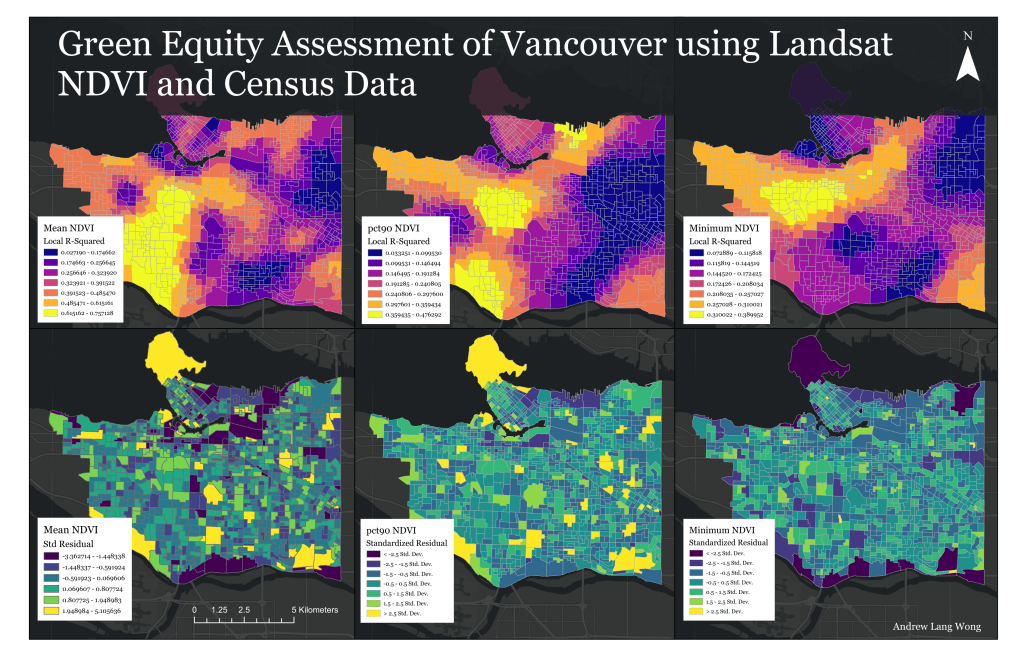
Description
Greenspace access is unevenly distributed across urban neighbourhoods. This analysis applied Geographically Weighted Regression (GWR) to census data from Vancouver dissemination areas, using NDVI as a proxy for greenspace access and ten socioeconomic indicators as predictors to explore where, and for whom, that inequity is most pronounced.
